
Keys To Understand Divergence

Divergence is a widely known concept and strategy amongst most traders. If you have been trading long enough, chances are you have come across this strategy through a friend, tried it yourself, or perhaps you are trading with it right now.
Now, the word "Divergence" may sound scary, but trust me, it's actually a very fun tool to use when it comes to trading.
In this blog, we are going to break down all the elements that are involved with Divergence, and give you a better insight of why it happens and when to actually trade with it.
Here's What We Will Be Going Over
1. What is Divergence?
2. What Indicator to Use
3. Types of Divergence
4. When to look for divergence
5. What Causes Divergence?
1. What Is Divergence?
If I was to give you a simple short answer, when you see the word Divergence just think of the word "Opposite".
Two parties fighting essentially.
When the price on your charts does not match what your indicator is saying, that is divergence.
Here's an example of divergence with the MACD indicator (this works with other indicators as well): 
Notice, how the price continues to rise on the charts but the indicator, which normally follows the price, is actually starting to turn downwards.
I know what you're thinking...
"What is this forex voodoo magic?"
This actually happens quite a lot in the markets. One of the reasons why divergences are very popular is because they give a hint into a possible reversal coming.
2. Which Indicator Do I Use?
Although this is a great, and very common question, the type of indicator you need to use is not as important as you think.
As a rule of thumb, any momentum based indicator will work perfectly fine. Two such indicators would be the MACD and the RSI.
Have a look at the example below:

This is a market with a divergence showing up using the MACD indicator.
Similarly, if we plug in the RSI indicator, we have a very similar result:

3. Types of Divergence
There are basically two different types of Divergences:
- Regular Divergence
- Hidden Divergence
For each of these there is a possible buyer or seller indication (also known as a bullish bias or bearish bias).
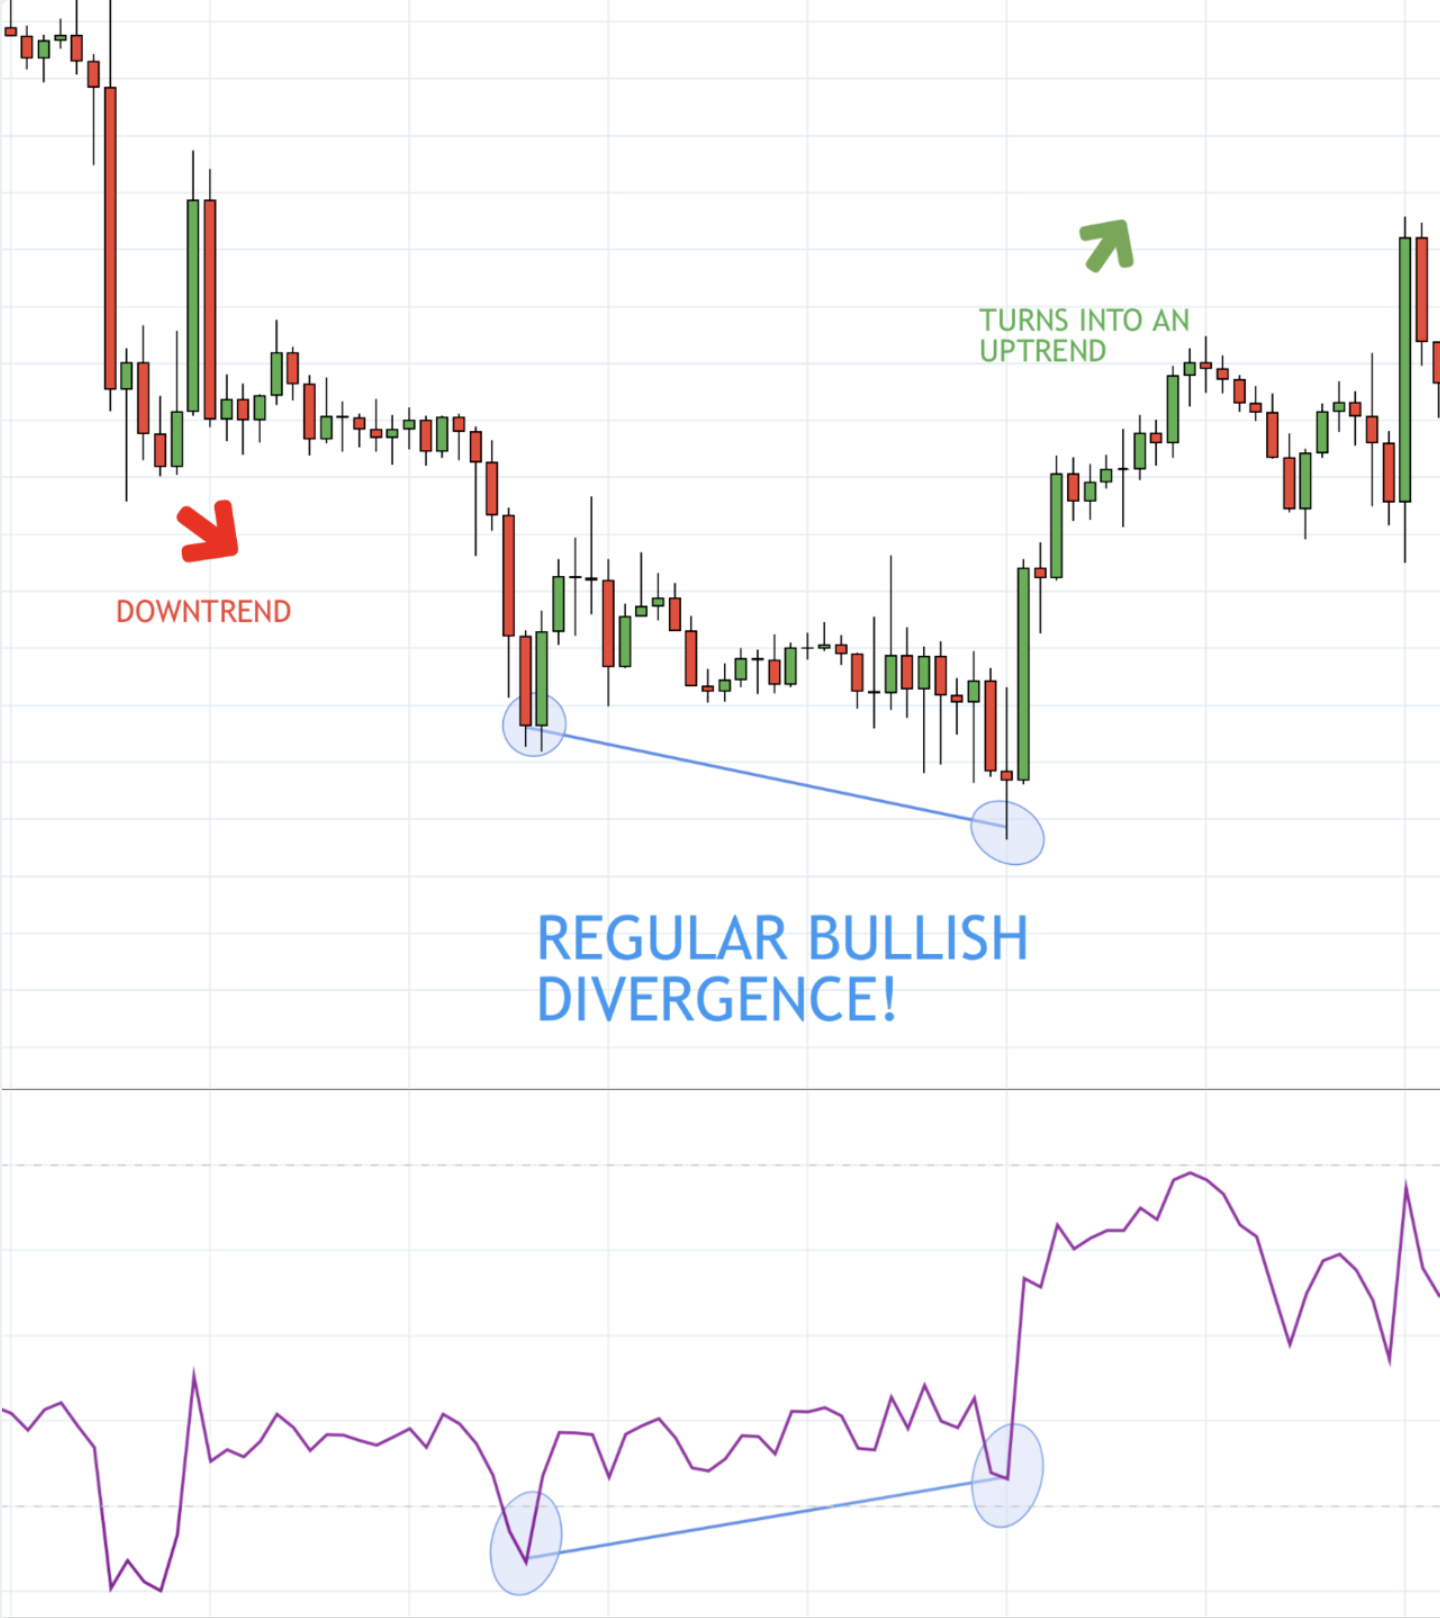
Regular Divergence
Regular Divergence indicates the end of a trend and signals a trend reversal. In other words it indicates that if the price was trending downward for some time, it will soon start to trend up - and vice versa of course.
Take a look at the image below:
And here's another example of a regular divergence but this time for a sell coming up.

Hidden Divergence
Hidden Divergence happens during a trend and signals that the trend may continue after taking a bit of a pause. In other words it indicates that if the price was trending downward for some time and then paused for awhile, it may now continue in that same direction.
Check out the image below:
And here's another example of a hidden divergence but this time for a sell.
I know with the word 'hidden', it could sound a little difficult to spot these Hidden Divergences.
But with a little practice, you will be a pro at identifying Hidden Divergence!
4. When to look for divergence
Wouldn't it be nice to know ahead of time where in the market these types of moves may occur?
Well I am glad you asked. And that could be considered the Million Dollar Question!
A lot of the time, these sudden moves will occur near the end of a slow steady pullback. And often, that can mean the market is looking to resume its original trend.
Take a look below:

Just because there is a divergence in the market, it doesn't mean the price will turn. We have to use it in the right context, knowing that we are in a trend, we are pulling back into a key level, etc.
5. What causes Divergence (sharp moves down or up)
The first step to spotting divergence is understanding that divergence occurs when price moves so fast on the chart that the indicator can not keep up.
Kind of like how I was in school, I couldn't keep up in class at times 🤷♂️
Remember, indicators always try to follow price as much as possible. So the key to finding divergence is to look for those sudden/sharp moves in the market that will cause the indicator to fall behind.
Of course, it has to be in the right context.

The one above is an example of a sharp down move causing divergence.
And of course, you can find divergence in the other direction as well. The one below here is a sharp move up that causes divergence.

Conclusion
Like many of the other classic indicator based strategies, divergence can definitely be useful in trading. But having that said, it's extremely important to use divergence in the right context.
Understanding when to use them and when not to, is one of the many keys to successful divergence trading :)
Looking for more divergence examples? Find them HERE
With Pip Love,
Lucas at Urban Forex

Receive Navin Prithyani's Free Foundational Course

Categories
All Categories