
How Do You Improve Your Support & Resistance Awareness for 2023

If you're wondering...
1. No, I can't get enough of writing blogs about Support & Resistance.
2. There can never be too many blogs around Support & Resistance.
Trading with the help of Support & Resistance has been an integral part of how we trade at Urban Forex and many students have reaped the benefit from learning and mastering it.
It's always the simplest thing, (Drawing a horizontal like), that takes work to master. Otherwise, my 6 year old niece could probably do the same job as we are in the markets.
Today, we'll be looking at a few things around Support & Resistance that you should understand first, before trading them. These are the things Navin personally look at to isolate the best Support & Resistance to trade at.
Here are the topics that will be covered:
1. Aligning with the Big Boy
2. Look for Shock Value
3. Visibility on the Universe Above
1. Aligning with the Big Boy
As the price approaches a "good" Support & Resistance in the market, there will usually be sizeable reaction off it. To understand these phenomenal, we first have to understand how these big reaction takes place. In order to do this, let's run through a simple scenario together.
Let's say, there's a big player in the market who is intending to buy 1 million share of the company, Letsa, at $100. And that big player is say, Gill Bates.
Now Gill cannot just outright buy 1 million of those shares, in order for him to do that, he needs to have enough sellers to sell those shares to him. If he doesn't have enough sellers selling to him at $100, where he is looking to buy, price will sky rocket, and he won't be looking at a $100 share price anymore.
Here's an example when Gill actually have enough sellers selling to him as he's looking to make his purchase: 
Notice how price consolidates before launching? Thats when Gill is able to slowly buy all the shares he wants at his desired price.
Now, on the flip side: 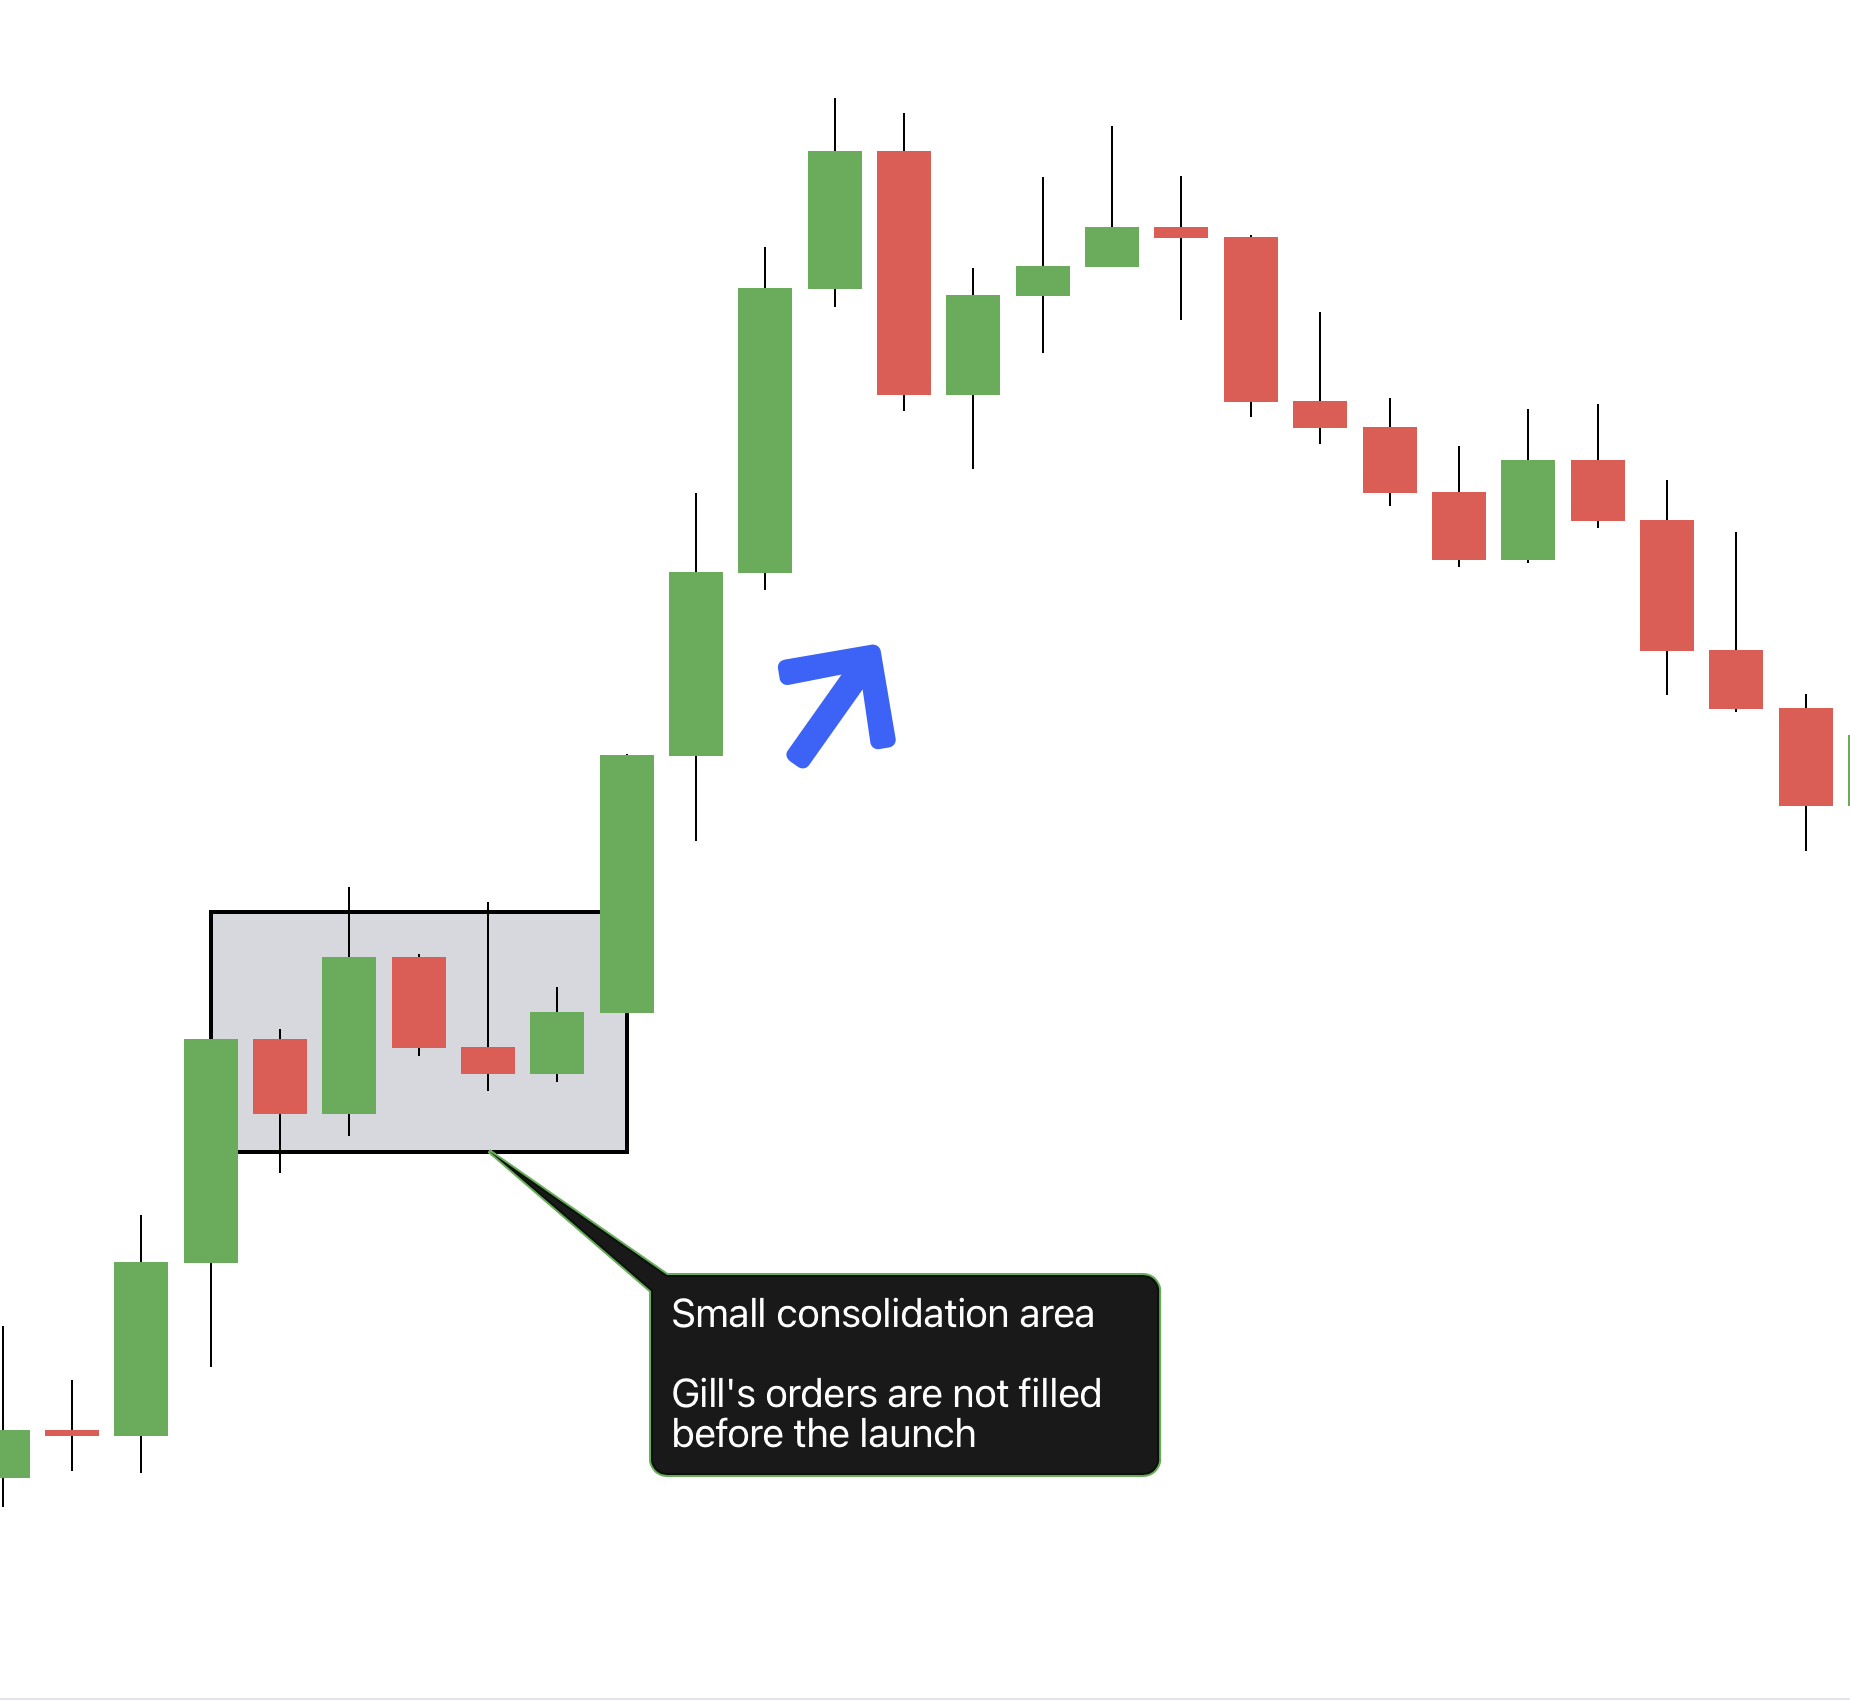
Here, noticed there is no consolidation at all. This is an indication that Gill was trying to buy 1million shares at $100, but there were not enough sellers selling to him. And so, price sky rocketed.
And here's the thing, if a big player like Gill wasn't able to get his orders filled, that launch may quickly run out of steam. Because there is no big player backing that move.

Which in this case, some traders would just say,
'Oh, turns out this Support & Resistance is not that good'
Merely understanding this concept will put you ahead of the game by leaps and bounds. Keep this concept in mind as we look into the other topics below.
2. Look for Shock Value
There's this place I go to for burgers, and they serve the best fries. The thing is, whenever i go there these days, I'm not even thinking about the burgers anymore, all I'm thinking about is the fries. It's just that good.
(yes I'm still aware I'm talking about Support & Resistance, getting to that.)
In trading, you want to look for that situation. Well not fries if you're wondering. But something that will get you thinking 'oh yea, I remember that!'. Let me show you on the charts:
Here: 
Nothing special here right? Who remembers a range that's not going anywhere.
This is like the broccoli I had who knows how long ago. No one remembers that.
And here:

Now this, oh people are going to remember that. Something dramatic just happened.
This is the fries I'm talking about!
Because it's something so dramatic, guess what will people be thinking if price ever comes back there?
"Remember what happened the last time it was here? Let's buy this now before it leaves without us" 
This, is what we call a price that has shock value. You want to look for these areas in the market as they create very strong Support & Resistance.
Also notice how this looks similar to the example where Gill is trying to buy all his shares in the market?!
3. Visible on the Higher Universe
Often times, traders tend to get carried away marking one too many Support & Resistance levels on their chart. The last thing you want is your chart looking like this: 
And no, just because you color code them, doesn't mean it will work.
Essentially, you want to be asking yourself the question of,
"Which level will Gill be looking to buy?"
Because if Gill is going to be buying there, chances are, there's going to be a big move off that area.
To do this, we check the universe above. What this mean is, you want to see if the higher timeframe also sees the level you are marking on your trading timeframe. That will be the more significant level, which will have a much higher odds of reacting strongly.
Here, this level is marked on my trading timeframe: 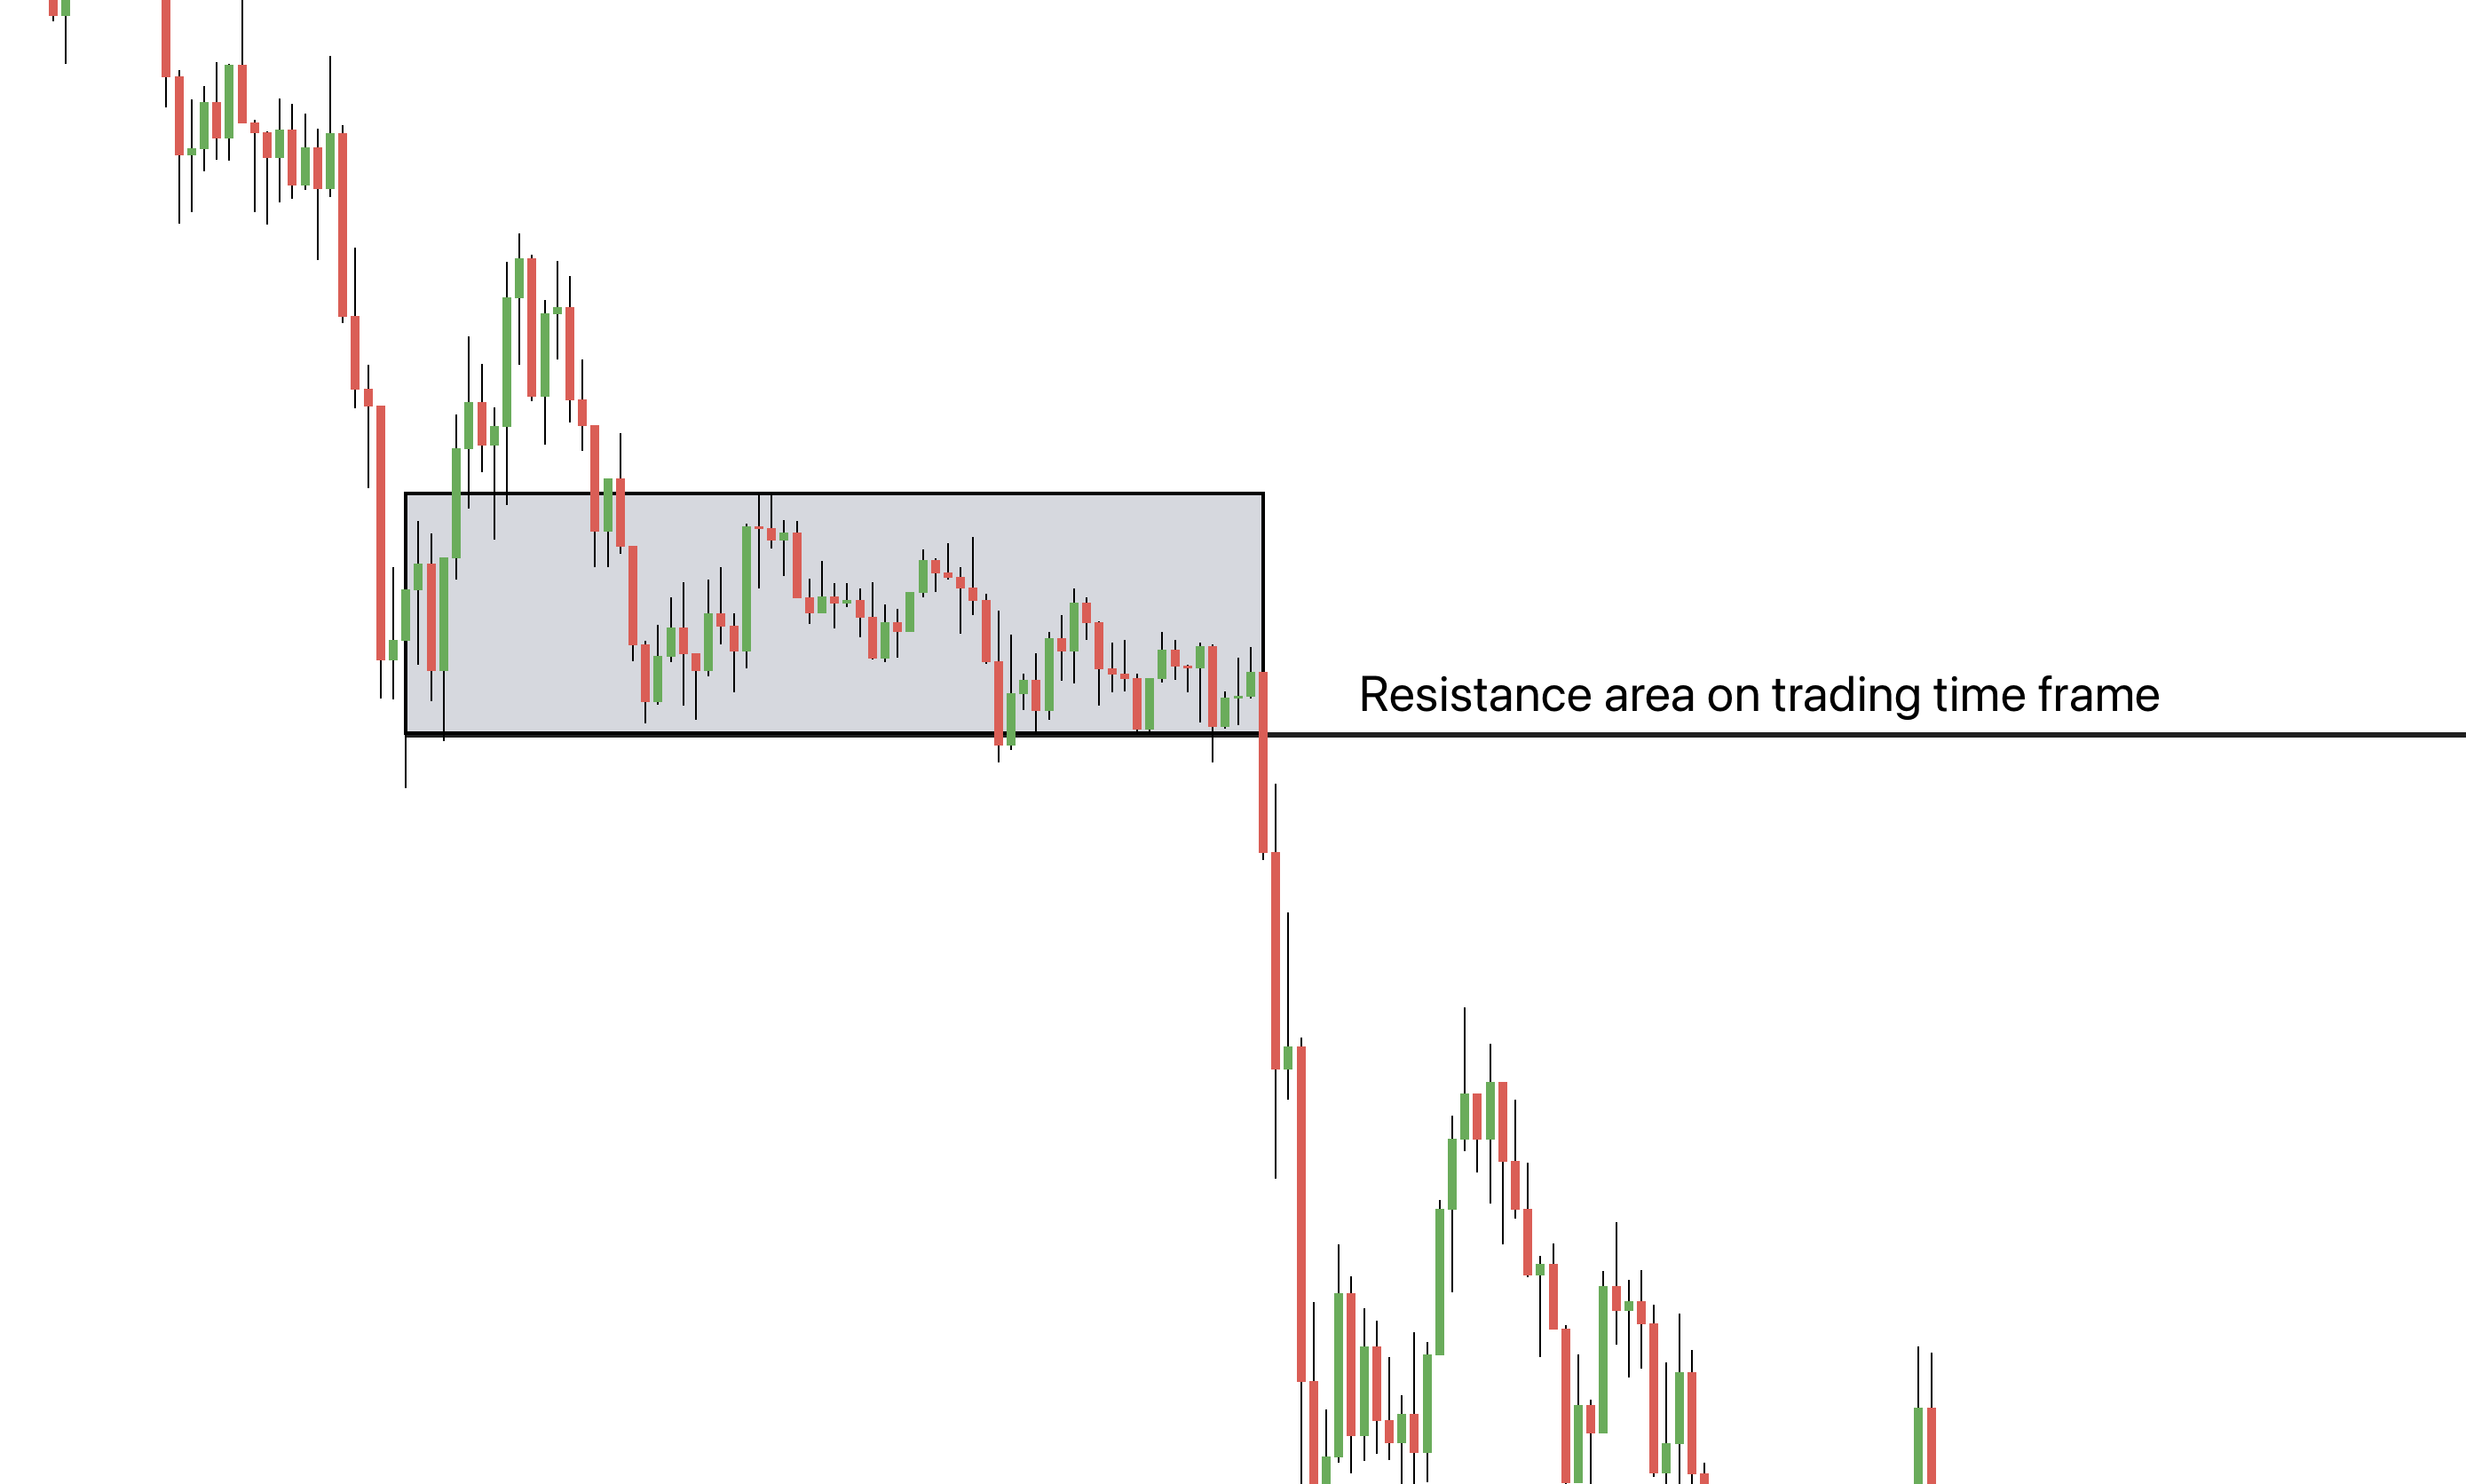
And when we hop on to the higher timeframe: 
Notice that it's also a well defined Support & Resistance on this timeframe?
This shows relevance. And what's visible on the higher timeframe will likely attract bigger players. And with bigger players (ie. Gill) looking at the same Support & Resistance as you are, your trade from those Support & Resistance will have a bigger launch.
Conclusion.
As you should know by now, trading at Support & Resistance is not just about how 'pretty' the line looks on your chart. At the same time, it's not rocket science either. You just need to understand what makes one line better than the other.
With that, I'm going to draw a line under it (No pun intended) and wish you the best trading year yet for 2023.
Pip Love,
Lucas
Urban Forex Team

Receive Navin Prithyani's Free Foundational Course

Categories
All Categories